Datawatch ZE PowerGroup Inc. (Datawatch)
Team Lead & Senior Graphic Designer // 2013-2016
Team Lead & Senior Graphic Designer // 2013-2016
PRINT DESIGN
Datawatch Monthly Magazine Industry News & Educational Publication
Datawatch Monthly Magazine Industry News & Educational Publication
Situation
ZE PowerGroup needed a professional monthly publication to position the company as a thought leader in data analytics, integration, and automation for the energy and commodity markets. The magazine had to deliver valuable industry insights while strengthening brand recognition and supporting client acquisition and retention.
ZE PowerGroup needed a professional monthly publication to position the company as a thought leader in data analytics, integration, and automation for the energy and commodity markets. The magazine had to deliver valuable industry insights while strengthening brand recognition and supporting client acquisition and retention.
Solution
As Senior Graphic Designer and Team Lead, I led the design and production of Datawatch, a dynamic monthly magazine that combined educational content with strategic marketing to engage both existing and prospective clients.
As Senior Graphic Designer and Team Lead, I led the design and production of Datawatch, a dynamic monthly magazine that combined educational content with strategic marketing to engage both existing and prospective clients.
Execution
• Designed a visually compelling, brand-aligned magazine template in Adobe InDesign, approved by executives.
• Integrated content from copywriters, including articles, stock photography, and data-driven charts from ZE PowerGroup’s proprietary software.
• Strategically placed advertisements for Lunch-n-Learns, user forums, and key marketing campaigns.
• Maintained consistent high-quality design, strong visual hierarchy, and professional polish across every issue.
Result
Datawatch became a highly regarded industry publication that enhanced ZE PowerGroup’s credibility and market leadership. It successfully attracted new clients, deepened relationships with existing customers, and reinforced brand loyalty through valuable, visually appealing content.
Datawatch became a highly regarded industry publication that enhanced ZE PowerGroup’s credibility and market leadership. It successfully attracted new clients, deepened relationships with existing customers, and reinforced brand loyalty through valuable, visually appealing content.
Examples
WEBSITE DESIGN
Datawatch Insights Platform Digital Publication Hub for Energy & Commodities Markets
Datawatch Insights Platform Digital Publication Hub for Energy & Commodities Markets
Situation
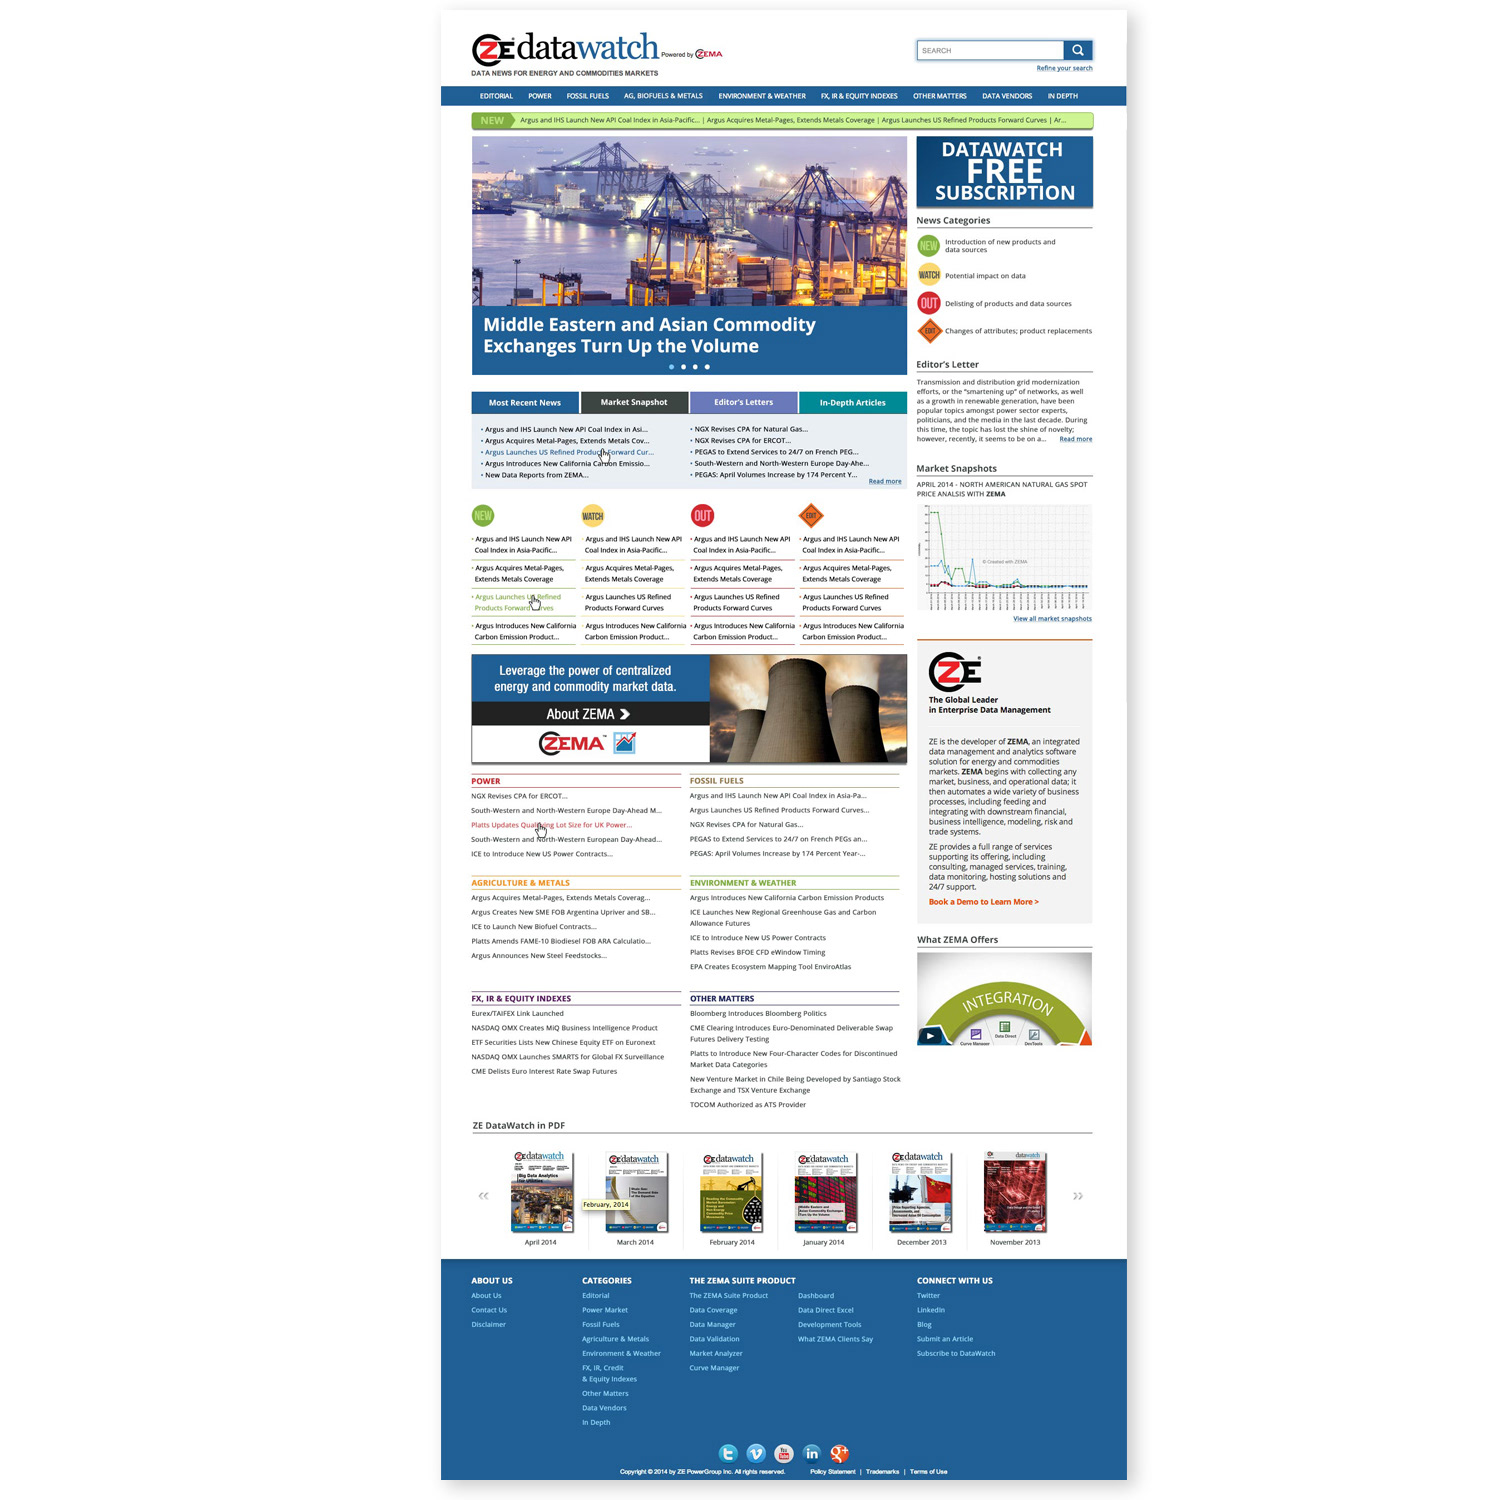
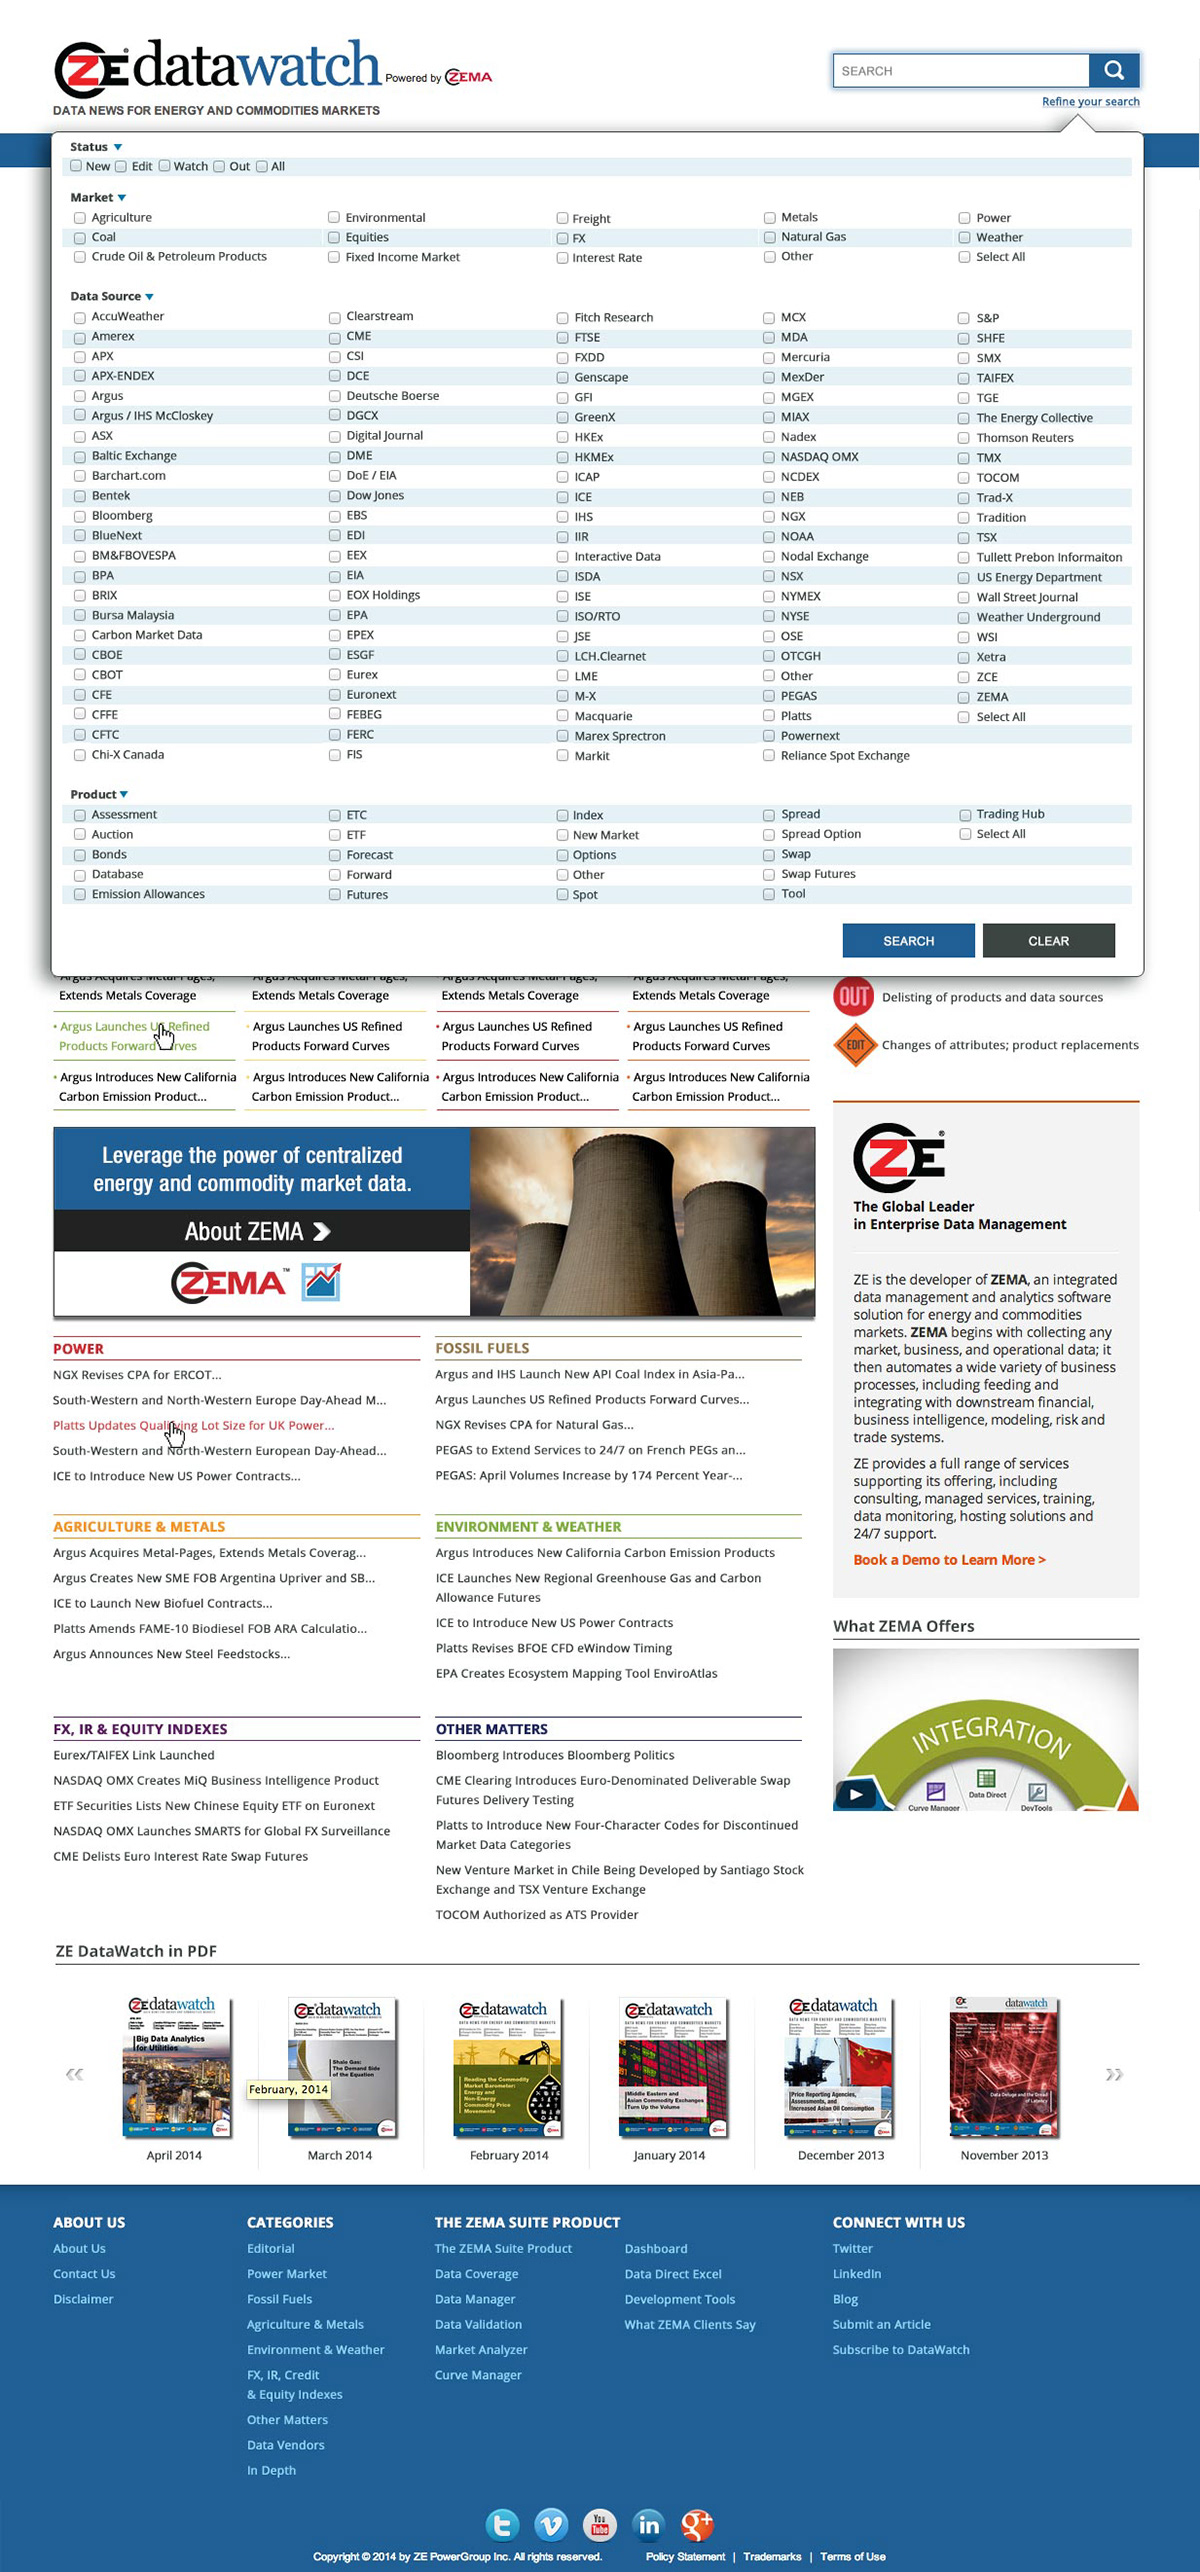
Datawatch, a specialized news and intelligence platform serving energy markets and commodity trading professionals, needed a modern, cohesive website to act as the primary hub for distributing monthly insights, reports, analytics, and industry updates.
Datawatch, a specialized news and intelligence platform serving energy markets and commodity trading professionals, needed a modern, cohesive website to act as the primary hub for distributing monthly insights, reports, analytics, and industry updates.
Solution
I designed a clean, user-friendly website layout template optimized for presenting complex market data and intelligence in an accessible, professional, and engaging format.
I designed a clean, user-friendly website layout template optimized for presenting complex market data and intelligence in an accessible, professional, and engaging format.
Execution
• Created an intuitive design system with strong information architecture and seamless navigation.
• Developed responsive layouts that work flawlessly across desktop, tablet, and mobile devices.
• Incorporated prominent calls-to-action for newsletter subscriptions, report downloads, and resource access.
• Integrated data visualization sections while maintaining consistent brand alignment across the site, email campaigns, and digital publications.
• Focused on clarity, readability, and usability for traders, analysts, risk managers, and industry professionals.
Result
The redesigned Datawatch website became a highly functional digital publication hub that improved user experience, increased engagement, and strengthened brand credibility. It provided fast, reliable access to valuable market intelligence, supporting professionals in the fast-paced energy and commodities sectors.
The redesigned Datawatch website became a highly functional digital publication hub that improved user experience, increased engagement, and strengthened brand credibility. It provided fast, reliable access to valuable market intelligence, supporting professionals in the fast-paced energy and commodities sectors.
EMAIL DESIGN
Datawatch Monthly Email Newsletter Recurring B2B Market Insights Campaign
Datawatch Monthly Email Newsletter Recurring B2B Market Insights Campaign
Situation
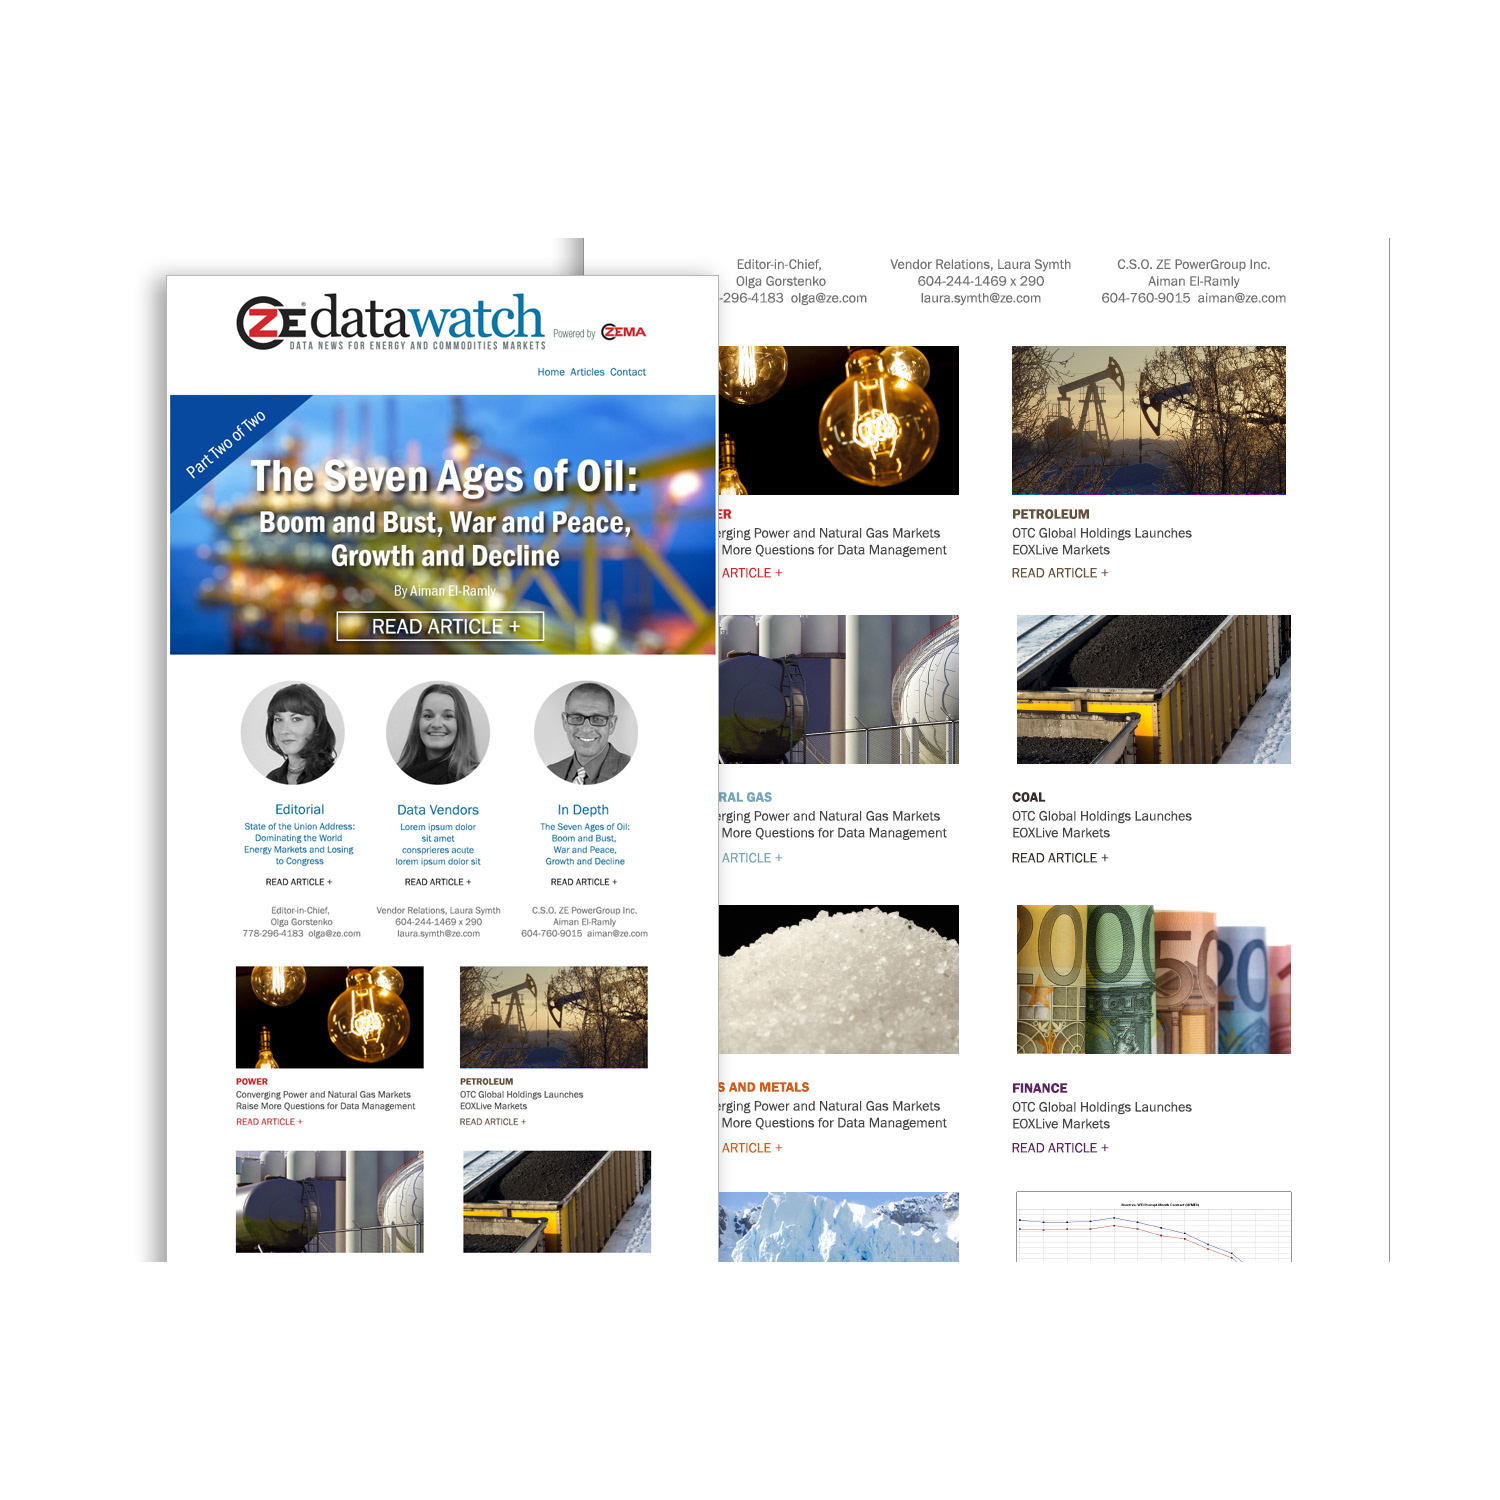
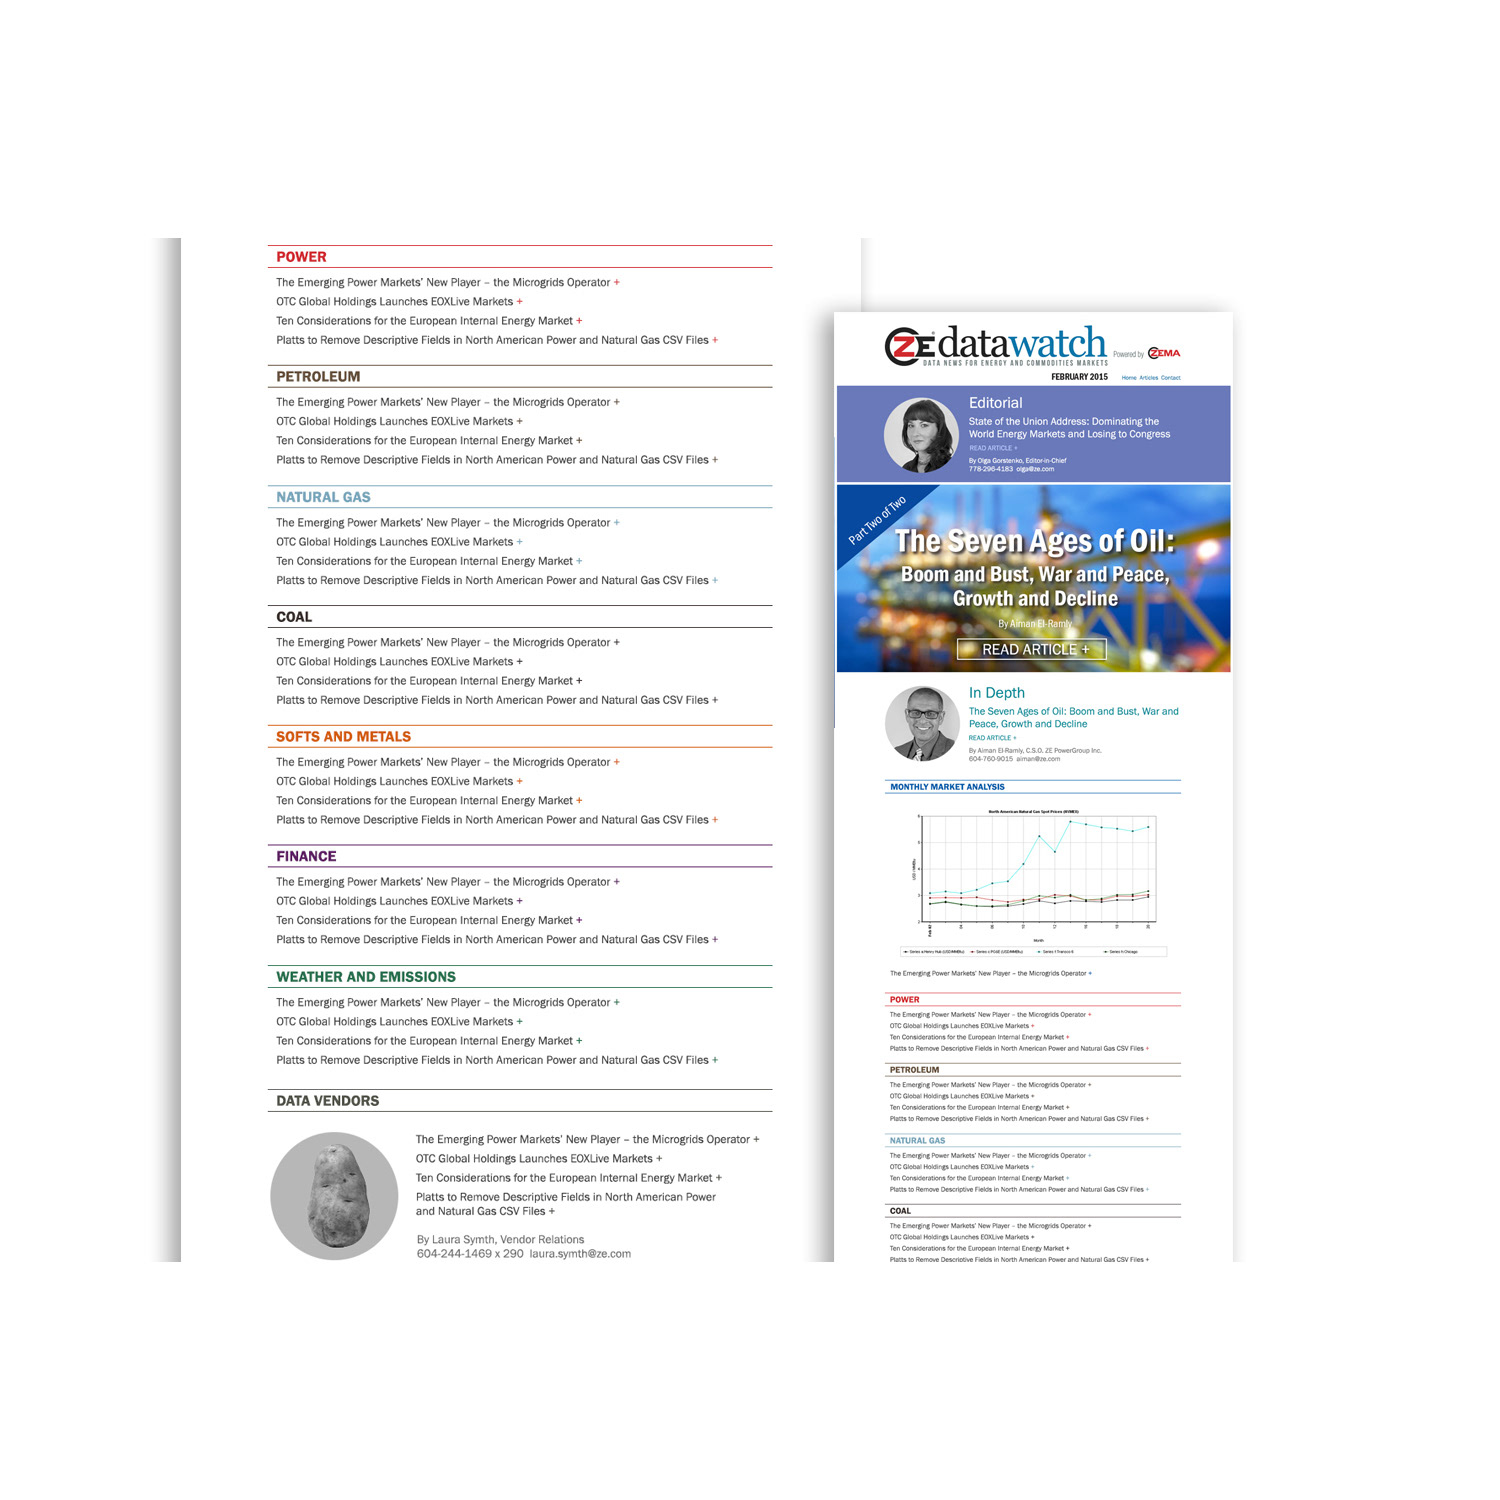
Datawatch, a leading news and intelligence platform for energy and commodities markets, needed a consistent, professional monthly email newsletter template to deliver timely market updates, reports, and insights to traders, analysts, and industry professionals.
Datawatch, a leading news and intelligence platform for energy and commodities markets, needed a consistent, professional monthly email newsletter template to deliver timely market updates, reports, and insights to traders, analysts, and industry professionals.
Solution
I designed a highly optimized, reusable email newsletter template that balanced strong visual appeal with clear communication of complex market information while reinforcing the Datawatch brand.
I designed a highly optimized, reusable email newsletter template that balanced strong visual appeal with clear communication of complex market information while reinforcing the Datawatch brand.
Execution
• Created a clean, responsive template optimized for desktop, tablet, and mobile devices.
• Established strong visual hierarchy, readable typography, and consistent brand elements across every issue.
• Integrated sections for key market insights, data highlights, trend reports, and promotional features (e.g., Lunch-n-Learns and user forums).
• Included prominent calls-to-action to drive website traffic, subscriptions, and event participation.
• Maintained a professional yet engaging aesthetic to support high open and click-through rates.
Result
The monthly newsletter became a reliable and valued communication channel that consistently delivered market intelligence to subscribers. It strengthened brand presence, improved engagement, and supported Datawatch’s position as a trusted resource in the energy and commodities sectors.
The monthly newsletter became a reliable and valued communication channel that consistently delivered market intelligence to subscribers. It strengthened brand presence, improved engagement, and supported Datawatch’s position as a trusted resource in the energy and commodities sectors.
View an archived example of the Spring 2016 edition: https://energyandcommodity.zema.global/email/datawatch/spring-2016.html
MAGAZINE DESIGN
Energy & Commodities Monthly Magazine Datawatch Publication
Energy & Commodities Monthly Magazine Datawatch Publication
Situation
ZE PowerGroup needed a premium monthly publication to establish thought leadership in the energy and commodities markets. The magazine had to deliver high-value insights to traders, analysts, and industry professionals while supporting marketing objectives and reinforcing brand credibility.
ZE PowerGroup needed a premium monthly publication to establish thought leadership in the energy and commodities markets. The magazine had to deliver high-value insights to traders, analysts, and industry professionals while supporting marketing objectives and reinforcing brand credibility.
Solution
I conceptualized, designed, and produced a sophisticated 60+ page monthly magazine called Datawatch, created in both limited-edition print and fully interactive PDF formats for maximum reach and engagement.
I conceptualized, designed, and produced a sophisticated 60+ page monthly magazine called Datawatch, created in both limited-edition print and fully interactive PDF formats for maximum reach and engagement.
Execution
• Designed a professional, visually compelling magazine template in Adobe InDesign.
• Integrated in-depth articles from copywriters, curated stock photography, and complex data-driven charts generated from ZE PowerGroup’s proprietary software.
• Transformed technical market data into clear, engaging visualizations with strong layout hierarchy and readability.
• Strategically incorporated promotional elements — including Lunch-n-Learns, user forums, and key campaigns — into the editorial flow without compromising the professional tone.
• Delivered both premium print versions and interactive PDFs optimized for email distribution and website hosting.
Result
Datawatch became a respected industry resource that strengthened ZE PowerGroup’s position as a leader in energy and commodities intelligence. The publication successfully balanced editorial excellence with effective brand promotion, enhancing client engagement, supporting lead generation, and delivering consistent value to a specialized B2B audience.
Datawatch became a respected industry resource that strengthened ZE PowerGroup’s position as a leader in energy and commodities intelligence. The publication successfully balanced editorial excellence with effective brand promotion, enhancing client engagement, supporting lead generation, and delivering consistent value to a specialized B2B audience.
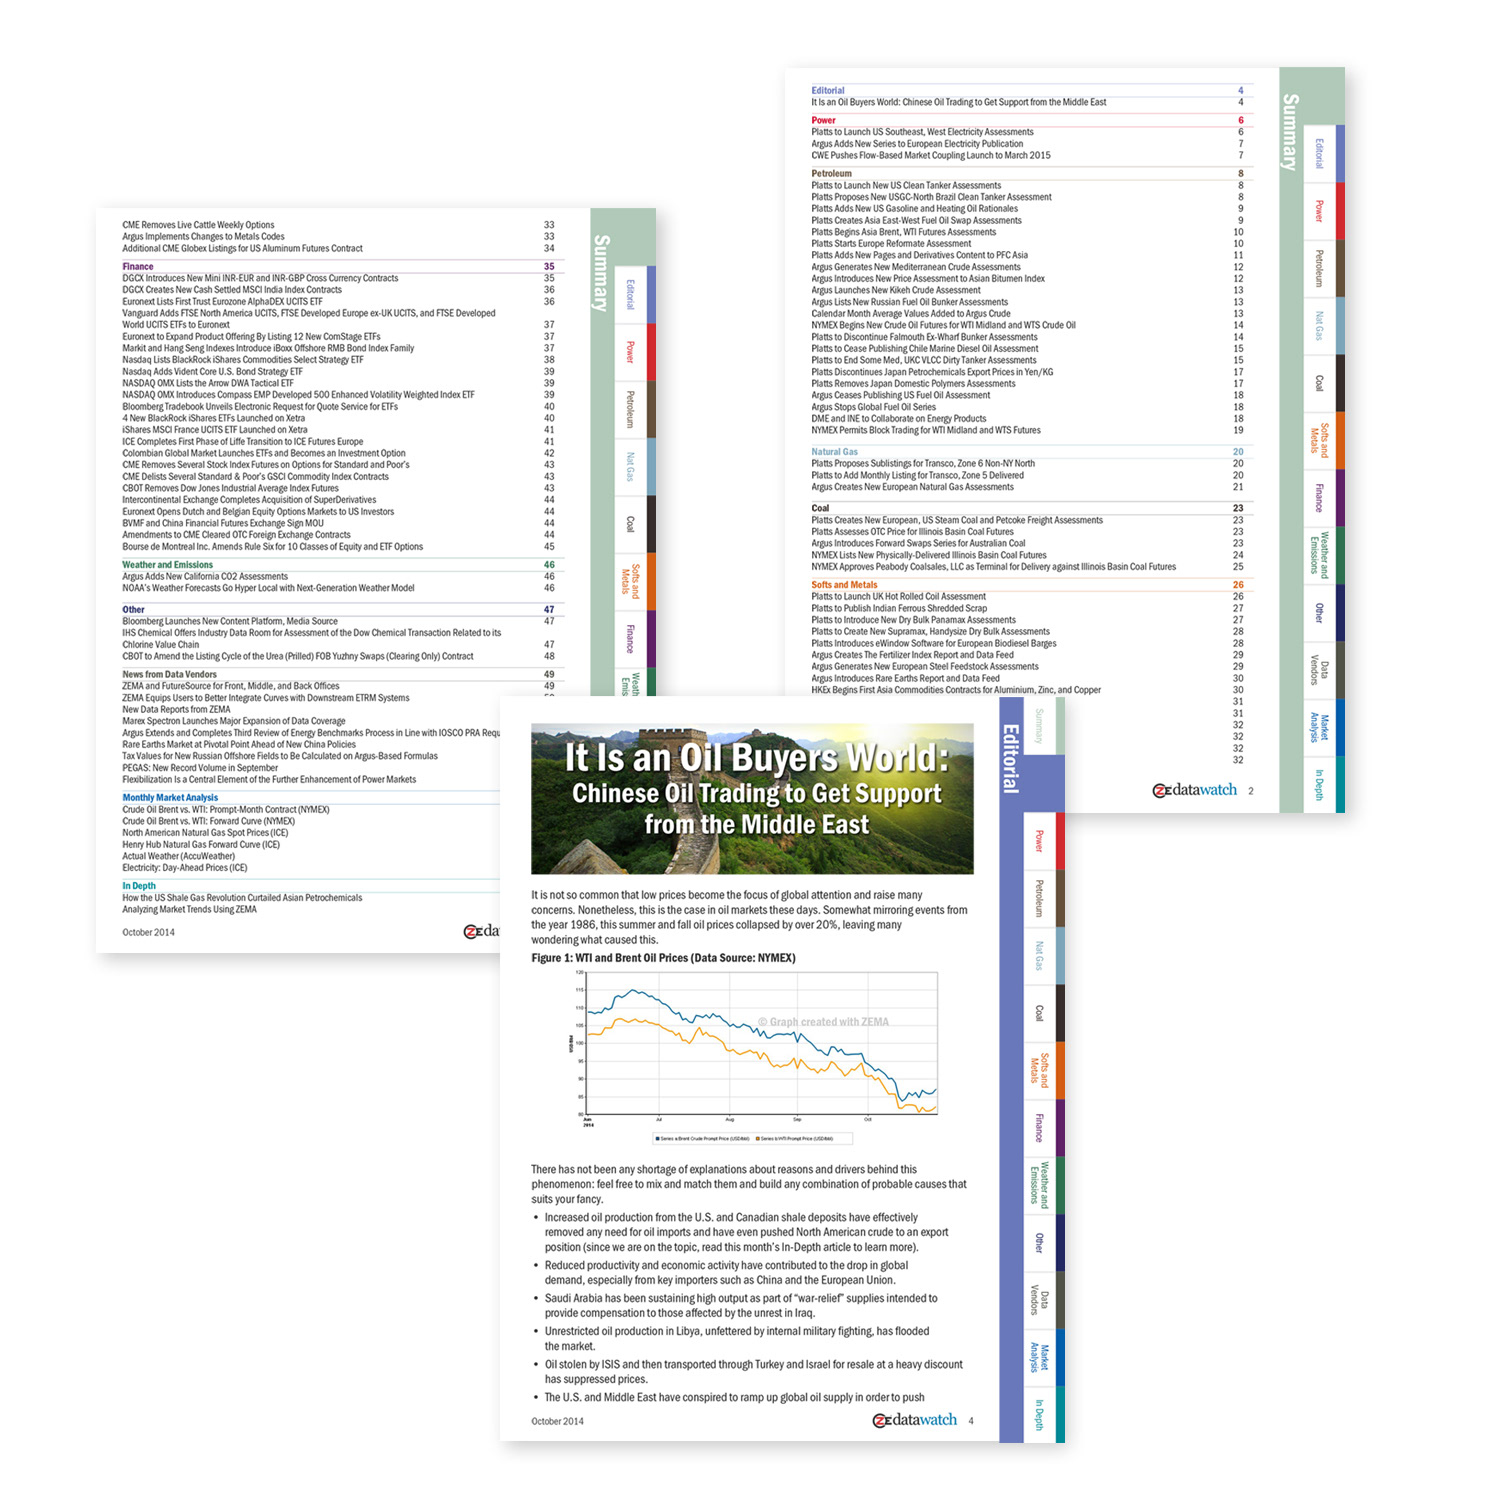
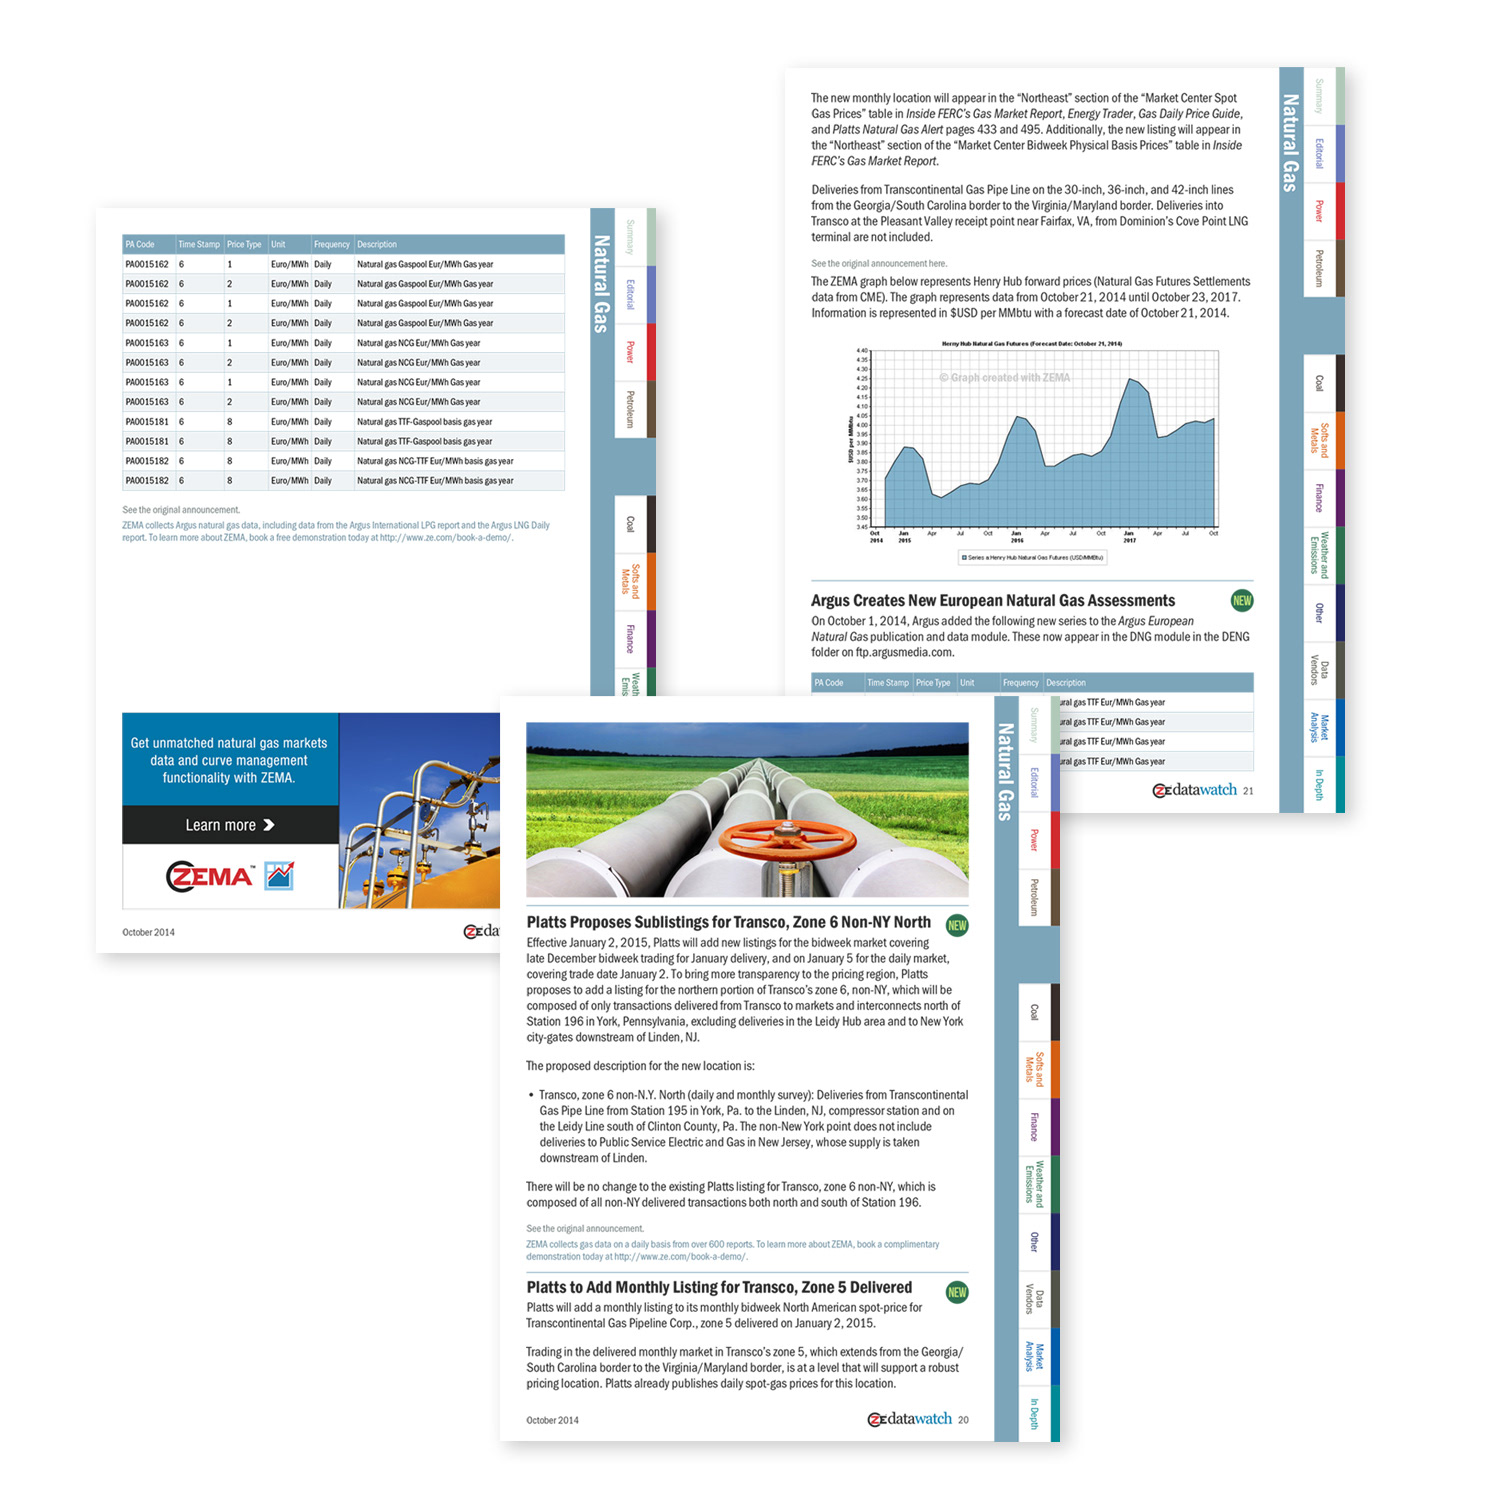
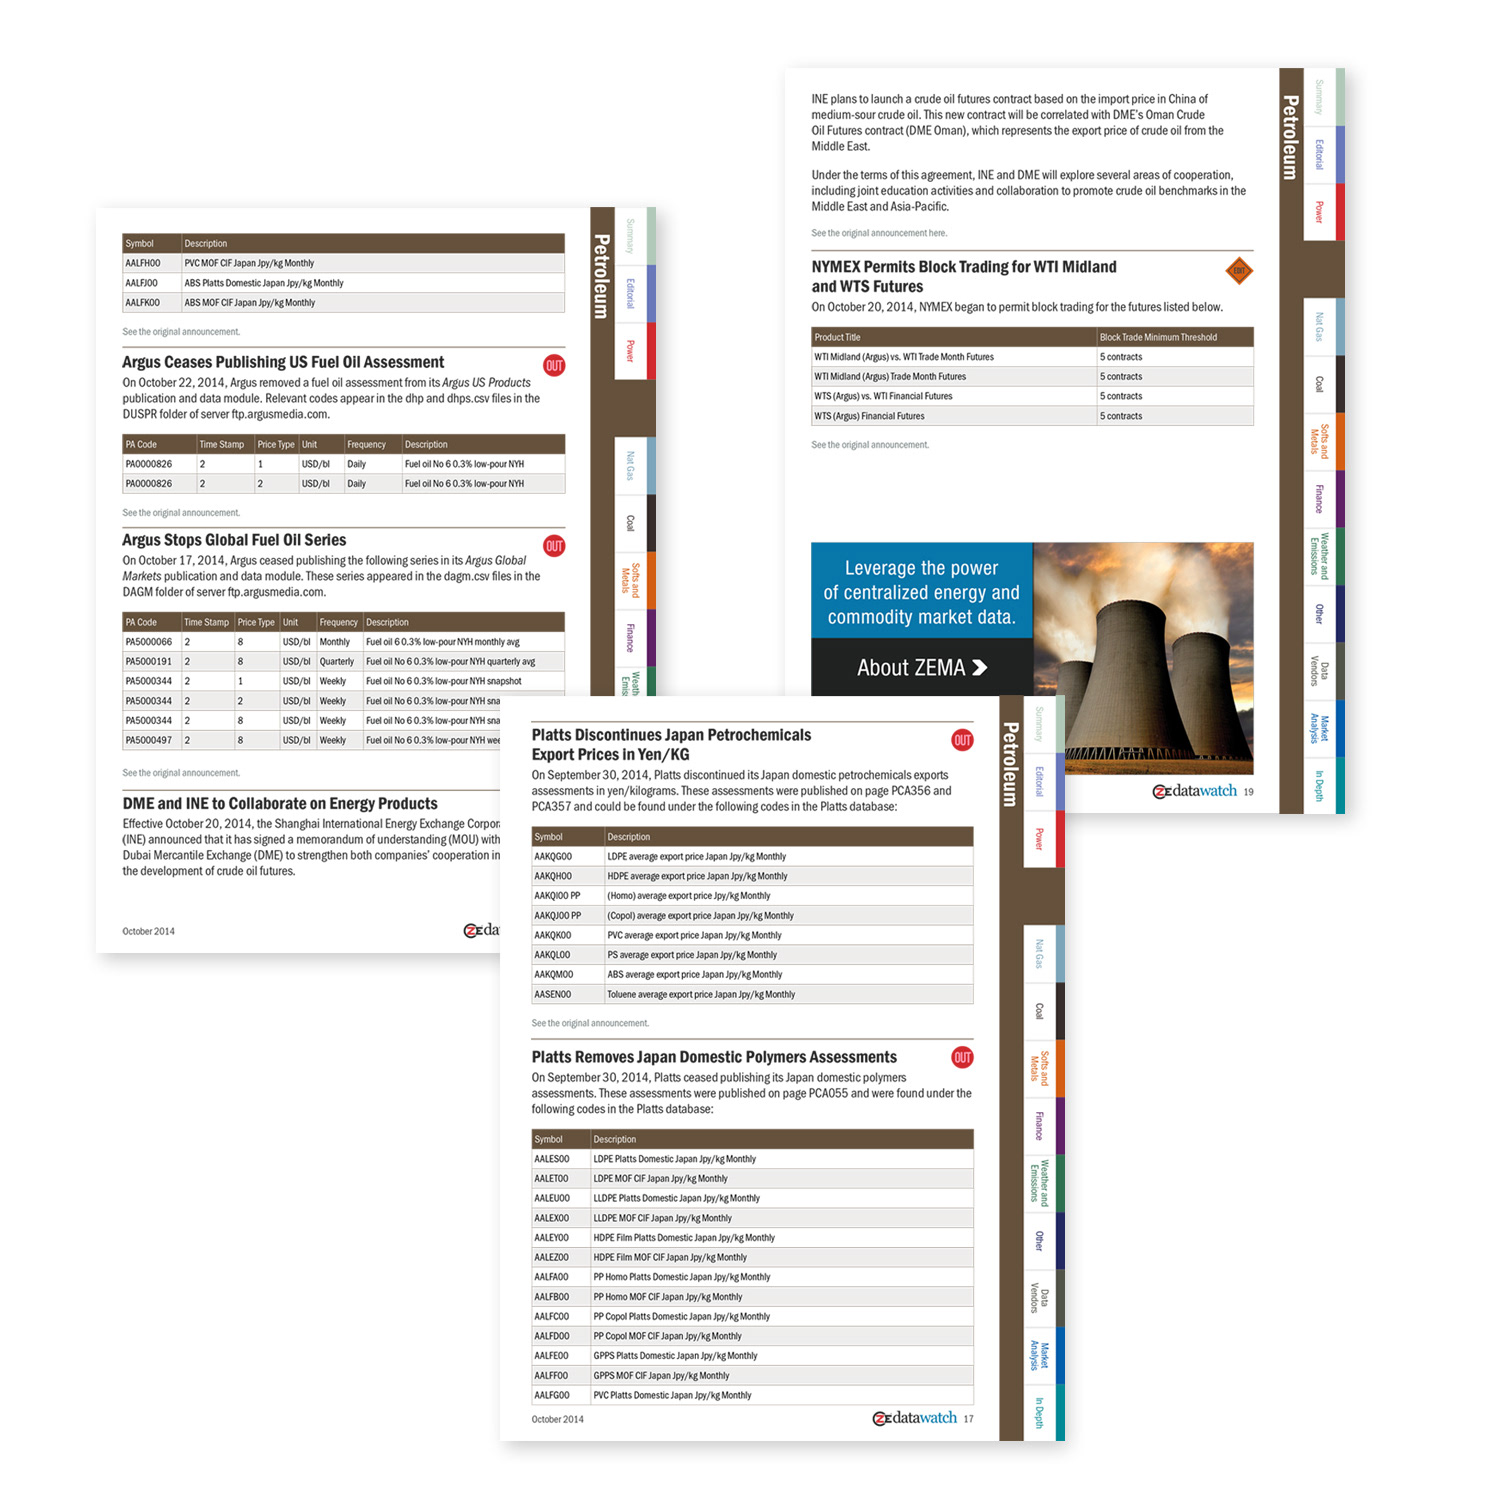
CHART DESIGN
Data Visualizations for Datawatch Energy & Commodities Market Intelligence
Data Visualizations for Datawatch Energy & Commodities Market Intelligence
Situation
Datawatch required clear, professional visualizations to communicate complex energy and commodity market data, trends, and analytics to traders, analysts, risk managers, and industry professionals in an accessible way.
Datawatch required clear, professional visualizations to communicate complex energy and commodity market data, trends, and analytics to traders, analysts, risk managers, and industry professionals in an accessible way.
Solution
I specialized in transforming dense datasets and technical information into intuitive, high-impact charts, diagrams, and infographics that enhanced understanding and decision-making across multiple formats.
I specialized in transforming dense datasets and technical information into intuitive, high-impact charts, diagrams, and infographics that enhanced understanding and decision-making across multiple formats.
Execution
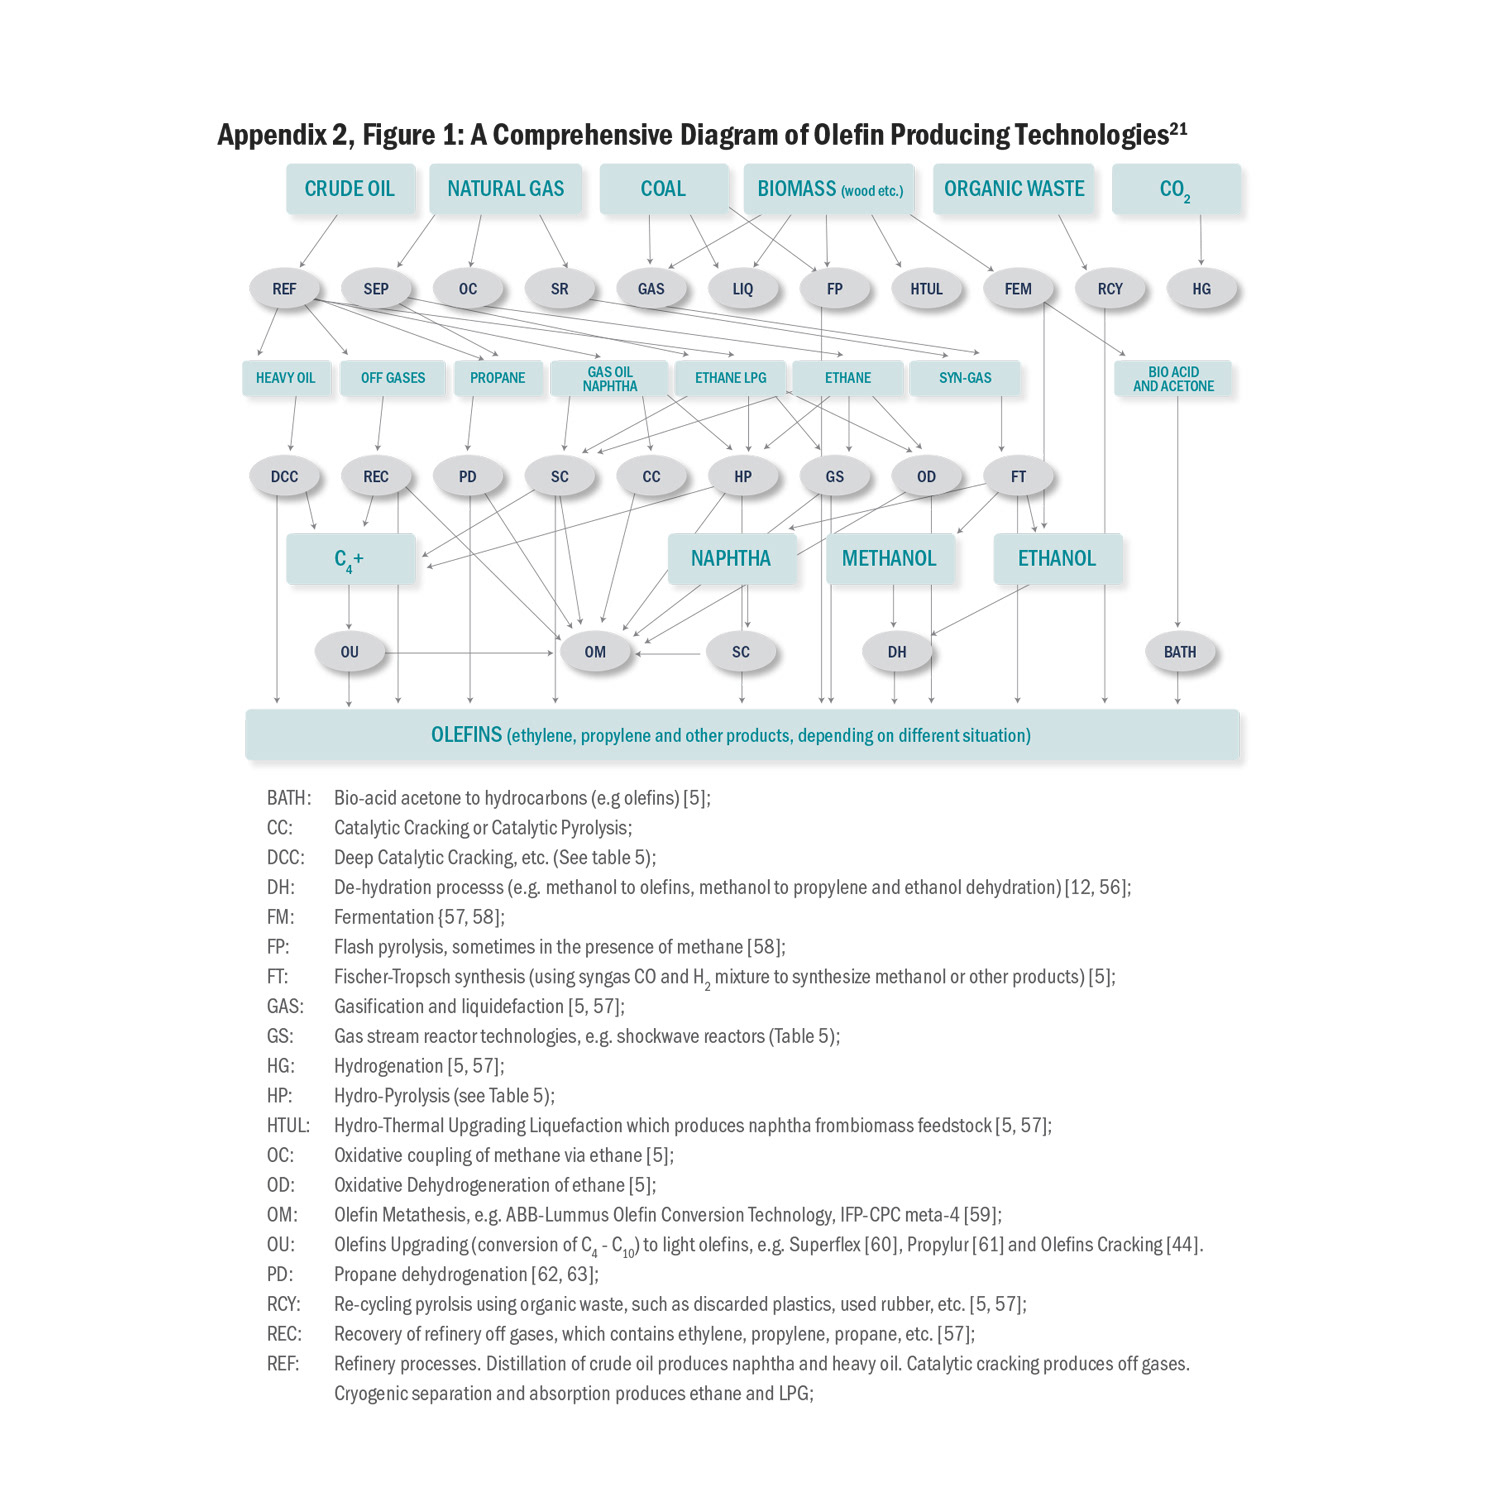
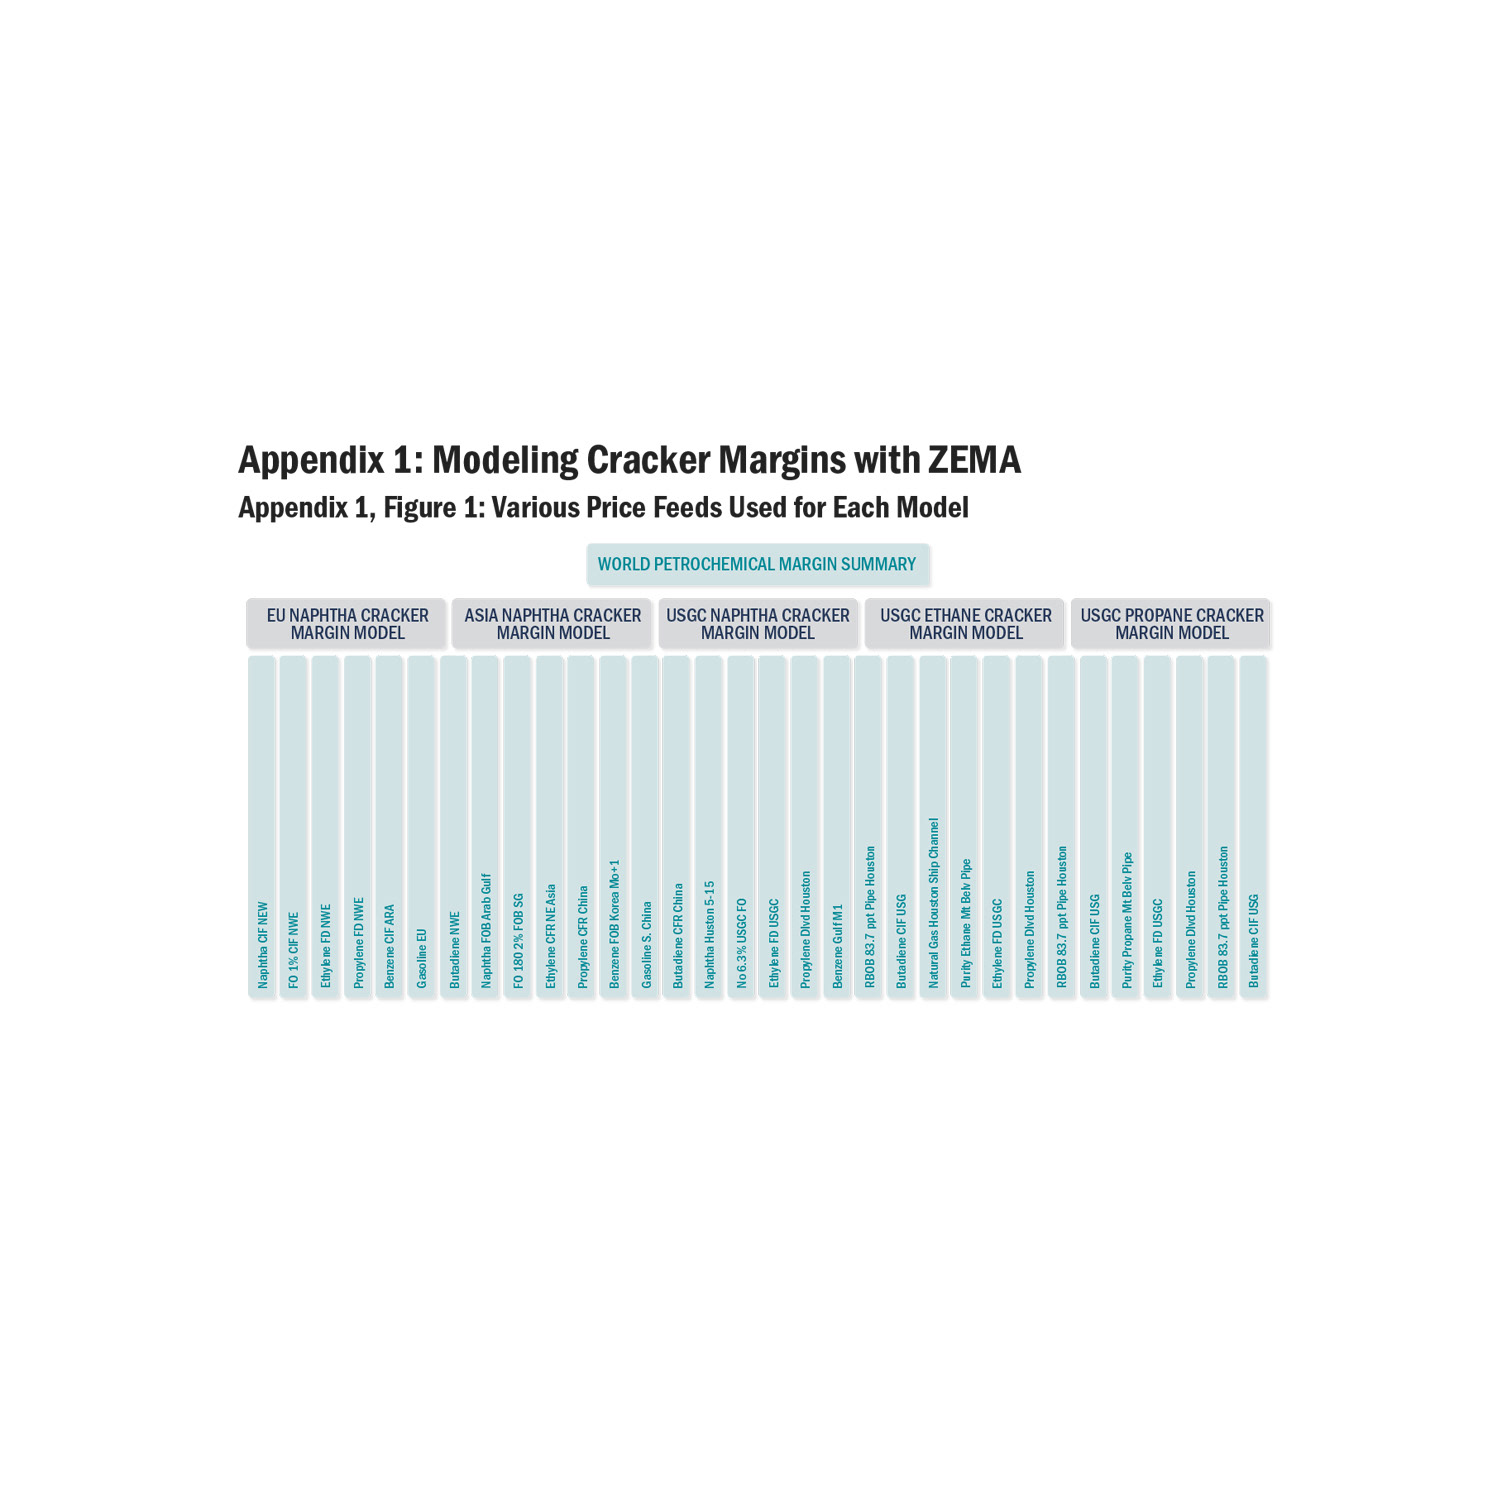
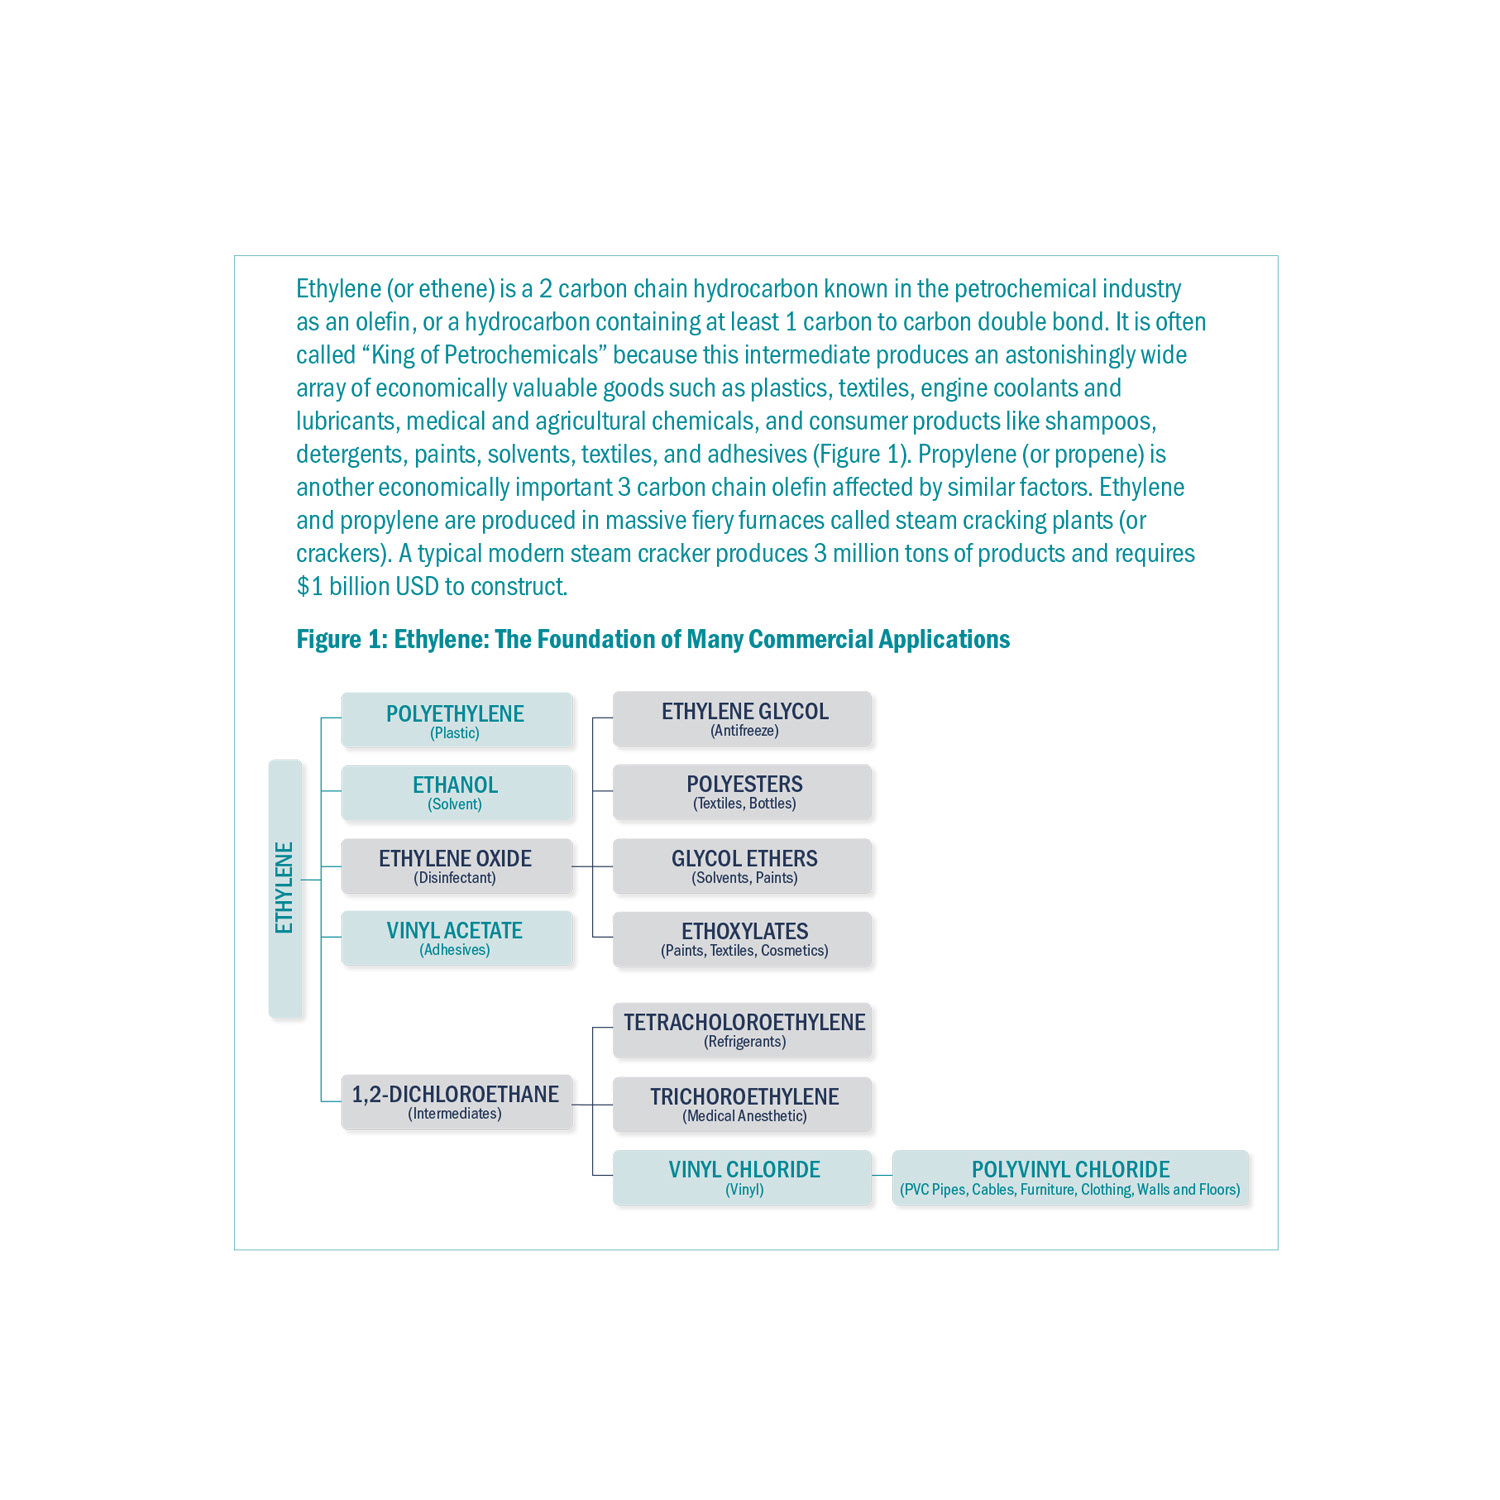
• Designed a wide range of custom visuals including line graphs for price tracking, bar charts for sector comparisons, flow diagrams for supply chains, and comprehensive infographics for monthly insights.
• Worked with data exported from ZE PowerGroup’s proprietary software, refining it into clean, accurate, and visually compelling graphics.
• Used Adobe Illustrator and InDesign to ensure strong visual hierarchy, brand consistency, and professional polish.
• Optimized charts for use in print magazines, interactive PDFs, website embeds, and email newsletters.
Result
The custom charts and diagrams significantly improved readability and engagement with complex market information. They reinforced Datawatch’s authority as a trusted source of intelligence in the energy, oil & gas, metals, power, and commodities sectors, supporting better-informed decisions for technical audiences.
The custom charts and diagrams significantly improved readability and engagement with complex market information. They reinforced Datawatch’s authority as a trusted source of intelligence in the energy, oil & gas, metals, power, and commodities sectors, supporting better-informed decisions for technical audiences.
ICON DESIGN
Datawatch Mobile App Icon Brand Extension for Energy & Commodities Intelligence
Datawatch Mobile App Icon Brand Extension for Energy & Commodities Intelligence
Situation
Datawatch, a specialized platform for energy markets, commodity trading, data analytics, and automation, needed a distinctive mobile app icon that would maintain strong brand recognition while appealing to professionals who need quick access to real-time insights.
Datawatch, a specialized platform for energy markets, commodity trading, data analytics, and automation, needed a distinctive mobile app icon that would maintain strong brand recognition while appealing to professionals who need quick access to real-time insights.
Solution
I designed a modern, professional app icon that extended the established Datawatch visual identity into a clean, mobile-optimized format.
I designed a modern, professional app icon that extended the established Datawatch visual identity into a clean, mobile-optimized format.
Execution
• Built directly on the core brand elements, colour palette, typography, and design language used across Datawatch’s website, magazines, newsletters, and charts.
• Created a scalable vector icon that clearly conveys the app’s purpose — delivering real-time market data, pricing, trends, and actionable intelligence.
• Optimized the design for excellent visibility and performance at all sizes (from small launcher icons to promotional graphics) on both iOS and Android platforms.
Result
The custom app icon successfully strengthened brand coherence across digital touchpoints, improved app discoverability, and enhanced user trust and download appeal in the competitive energy and commodities analytics space.
The custom app icon successfully strengthened brand coherence across digital touchpoints, improved app discoverability, and enhanced user trust and download appeal in the competitive energy and commodities analytics space.